

Click an image above to explore an FSW employment dashboard. Please note that the dashboards are hosted on an external webpage, and clicking an image will redirect you there.
Statewide Graduate Salaries
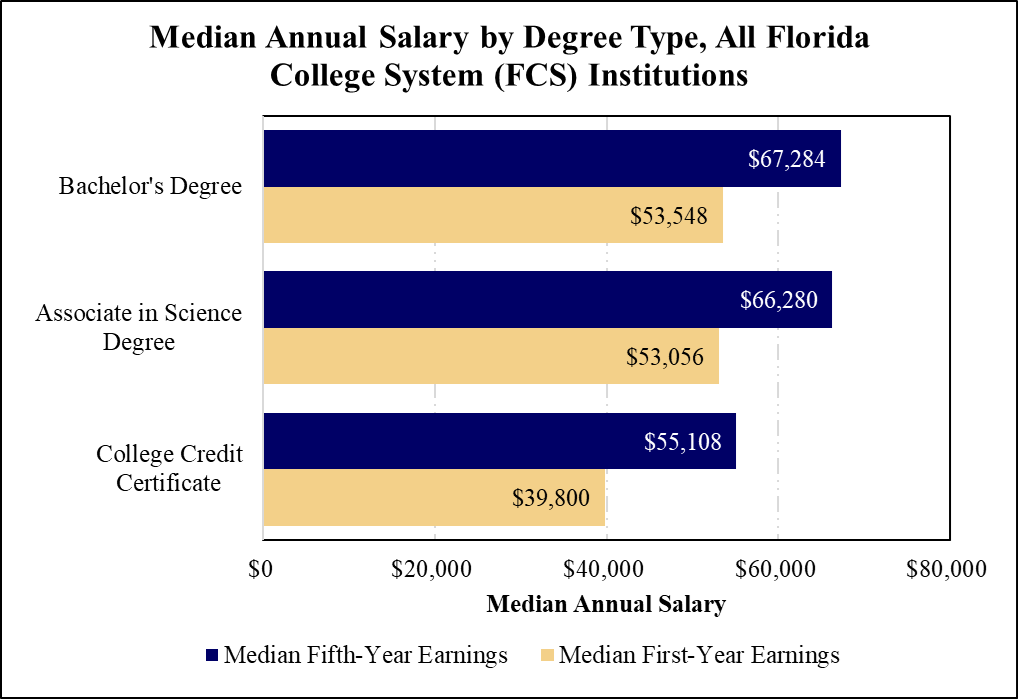
Graph showing the median annual salary by types of degree earned from Florida College System institutions. This data comes from the Florida Department of Economic Opportunity’s 2025 Economic Security Report. Note that the salaries indicated in the above graph represent salaries for those degree types across Florida College System institutions, not just at FSW. The AA degree type is not included because AA students typically go on to continue their education and do not go straight into the workforce after graduation.