Enrollment Executive Summaries
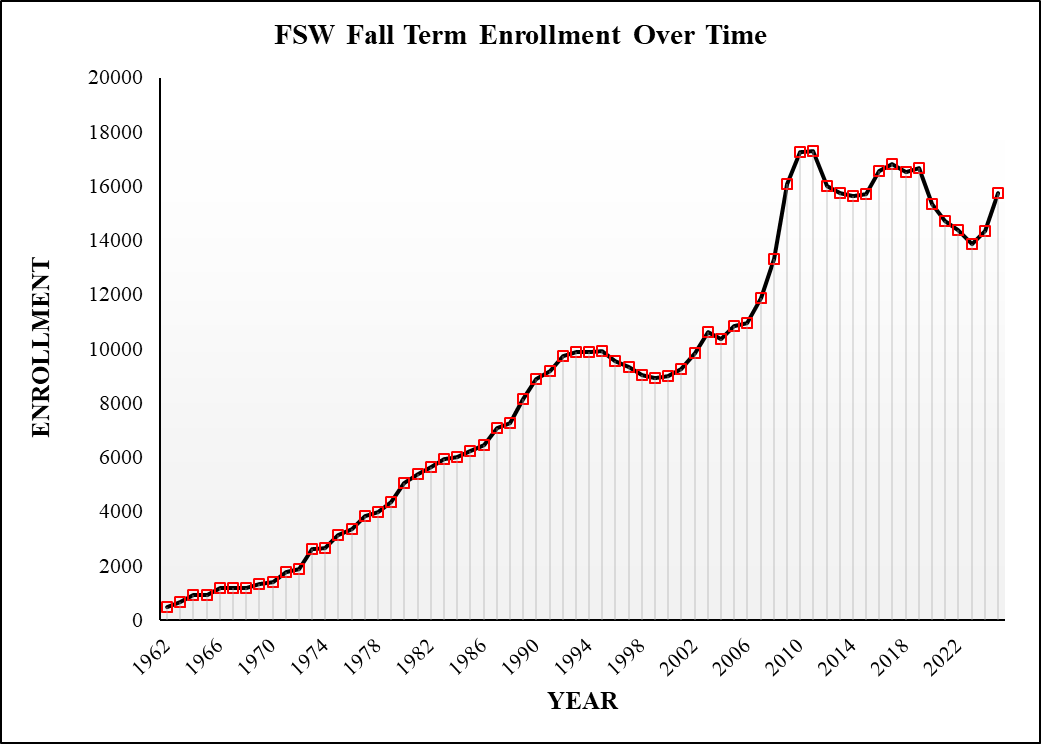
FSW Fall Enrollment: 1962-2025
Fall 2025 Top 10 Enrolled Programs
| Rank | Program Title | Rank Change Fall 2024 to Fall 2025 | Percent of Total Fall 2025 Enrollment | Student Count |
|---|---|---|---|---|
| 1 | AA General Studies | = | 68.6% | 10,814 |
| 2 | AS Nursing | = | 4.0% | 630 |
| 3 | AS Business Administration and Management | = | 2.9% | 456 |
| 4 | BS Nursing | 1 | 1.9% | 301 |
| 5 | BAS Supervision & Management | -1 | 1.9% | 297 |
| 6 | AS Science & Engineering Technology | = | 1.5% | 231 |
| 7 | AS Cybersecurity Operations | 3 | 1.2% | 190 |
| 8 | AS Emergency Medical Services Technology | 1 | 1.1% | 175 |
| 9 | BAS Information Systems Technology | * | 1.0% | 164 |
| 10 | AS Computer Programming & Analysis | -3 | 1.0% | 156 |
These numbers reflect primary majors within each respective program. Data Source: Frozen Fall 2025 AS_Student_Enrollment Summary View by Term(s). * = was not previously ranked.
Seven-Year Fall Enrollment for Fall 2025’s Top 10 Enrolled Programs
| Term | Total Enrollment | AA GENR | AS NURN | AS BAMA | BS NURS | BAS SMAN | AS SCET | AS CSOP | AS EMST | BAS ISTC | AS CPAN |
|---|---|---|---|---|---|---|---|---|---|---|---|
| Fall 2019 | 16672 | 12288 | 607 | 390 | 196 | 402 | 182 | 183 | 140 | ||
| Fall 2020 | 15335 | 10890 | 547 | 447 | 226 | 379 | 190 | 173 | 135 | ||
| Fall 2021 | 14714 | 10426 | 541 | 425 | 240 | 339 | 182 | 162 | 144 | ||
| Fall 2022 | 14386 | 10280 | 529 | 377 | 235 | 289 | 175 | 20 | 164 | 36 | 172 |
| Fall 2023 | 13860 | 9644 | 555 | 405 | 241 | 302 | 190 | 97 | 130 | 84 | 184 |
| Fall 2024 | 14358 | 9846 | 576 | 423 | 256 | 309 | 213 | 148 | 156 | 125 | 180 |
| Fall 2025 | 15765 | 10814 | 630 | 456 | 301 | 297 | 231 | 190 | 175 | 164 | 156 |
These numbers reflect primary majors within each respective program. Data Source: Frozen Fall AS_Student_Enrollment Summary View by Term(s).
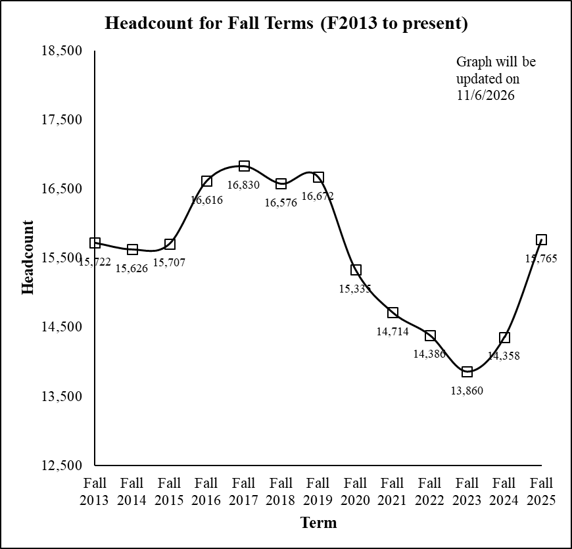
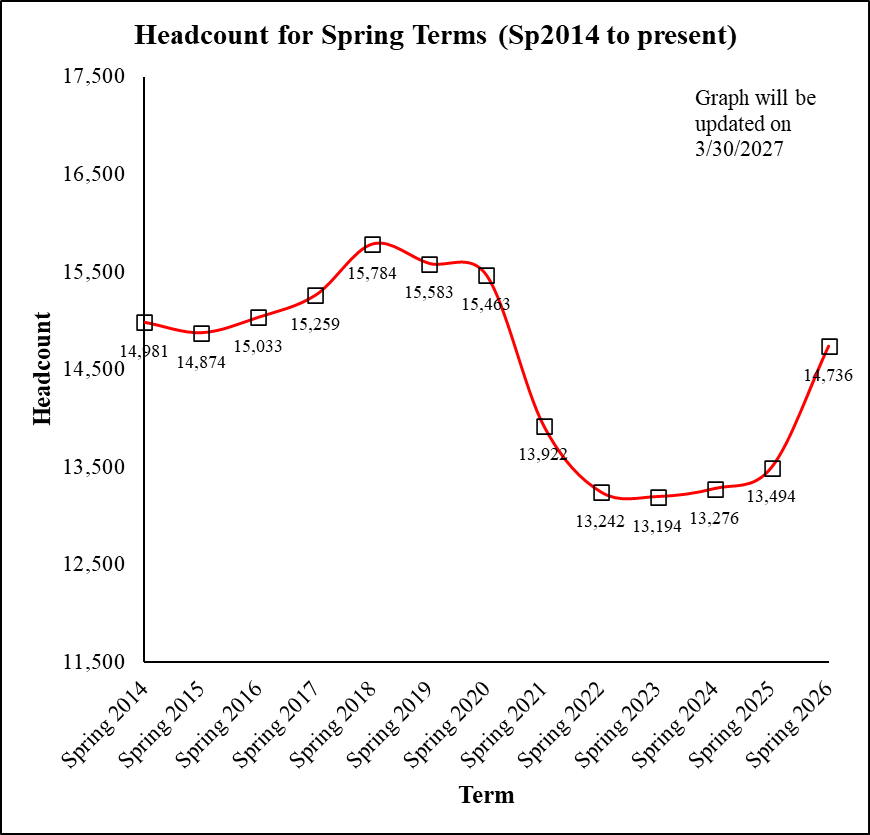
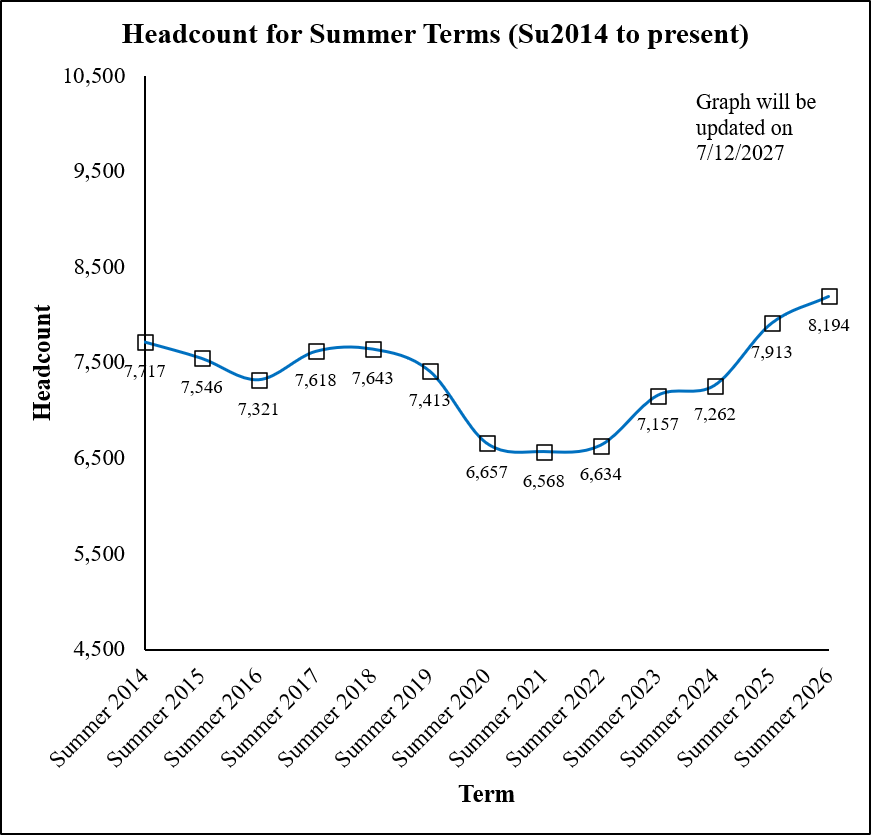
Enrollment by Term
| Academic Year | Fall | Spring | Summer |
|---|---|---|---|
| 2016-2017 | 16,616 | 15,259 | 7,618 |
| 2017-2018 | 16,830 | 15,784 | 7,643 |
| 2018-2019 | 16,576 | 15,583 | 7,413 |
| 2019-2020 | 16,672 | 15,463 | 6,657 |
| 2020-2021 | 15,335 | 13,922 | 6,568 |
| 2021-2022 | 14,714 | 13,242 | 6,634 |
| 2022-2023 | 14,386 | 13,194 | 7,157 |
| 2023-2024 | 13,860 | 13,276 | 7,262 |
| 2024-2025 | 14,358 | 13,494 | 7,913 |
| 2025-2026 | 15,765 | 14,736 | 8,194 |
Academic year is considered to be Fall, Spring, Summer.
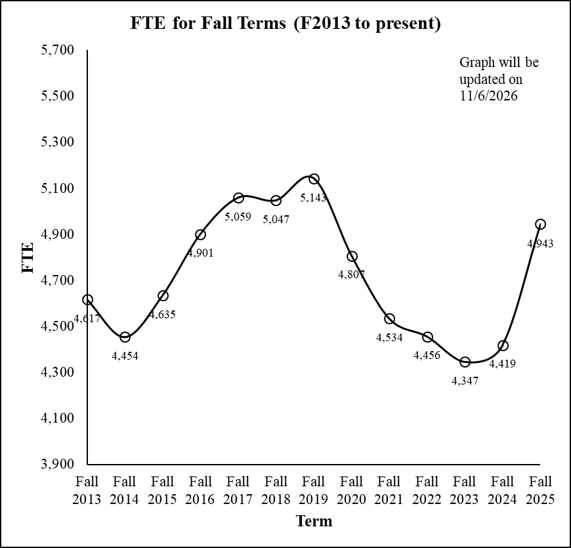
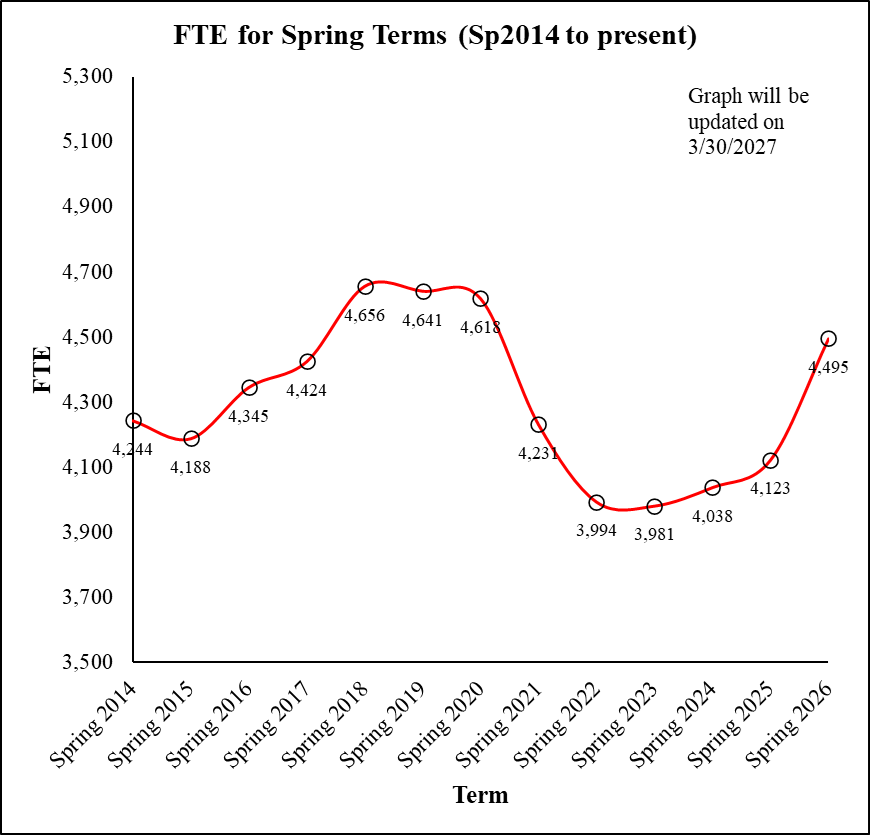
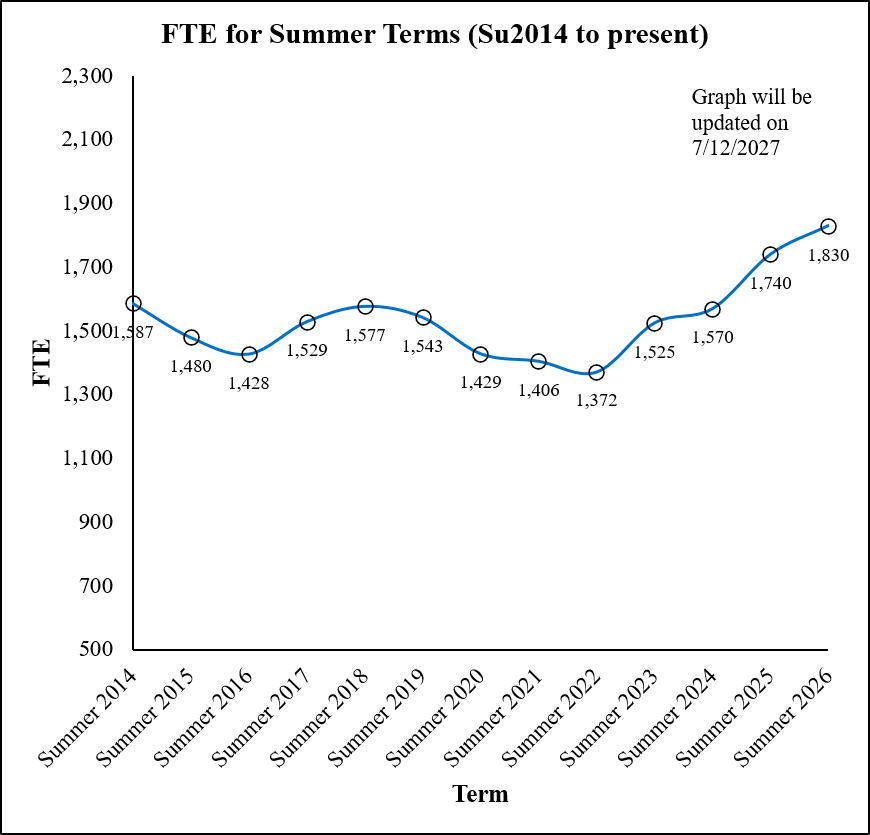
Please note that the summed FTE for a given academic year will not match the FTE-3 numbers on the General Statistics and Demographics webpage because the term data includes categories not included in the State's FTE calculations (e.g., dual enrolled in College's charter school).