| Academic Year | Bachelors Degrees Conferred | Associates Degrees Conferred | Certificates Conferred |
|---|---|---|---|
| 2019-2020 | 366 | 2,562 | 275 |
| 2020-2021 | 404 | 2,390 | 445 |
| 2021-2022 | 347 | 2,157 | 291 |
| 2022-2023 | 274 | 2,012 | 320 |
| 2023-2024 | 298 | 2,074 | 928 |
| 2024-2025 | 350 | 2,091 | 1,451 |
Data Source: Fresh Degrees Conferred by Term(s) file. Academic Year is considered to be Fall, Spring, Summer.
3-Year Graduation Rates
First-Time Full-Time Associate Seeking Freshmen
| Cohort | Graduated (n) | Graduated (%) | |
|---|---|---|---|
| Fall 2013 | 1810 | 444 | 24.5% |
| Fall 2014 | 1880 | 546 | 29.0% |
| Fall 2015 | 1870 | 598 | 32.0% |
| Fall 2016 | 2079 | 692 | 33.3% |
| Fall 2017 | 2081 | 725 | 34.8% |
| Fall 2018 | 1977 | 631 | 31.9% |
| Fall 2019 | 2074 | 590 | 28.4% |
| Fall 2020 | 1850 | 560 | 30.3% |
| Fall 2021 | 1797 | 470 | 26.2% |
| Fall 2022 | 1887 | 544 | 28.8% |
| Fall 2023 Goal | 29.4% |
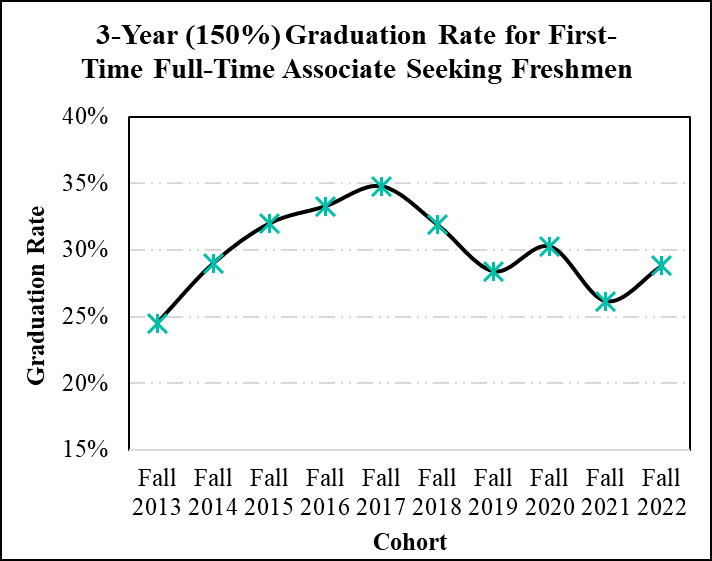
*Goals are set at one percentage point above the 3 year average.
FTFTF = First-Time, Full-Time Freshmen. FTFTF are students who are First-Time Freshmen and have full-time status in the Fall semester in which they were captured.
Degrees Conferred
| Academic Year | Degrees Conferred | FTE Degree Seeking Students | Ratio of Degrees Conferred to 100 FTE |
|---|---|---|---|
| AY 2015-16 | 2012 | 9311 | 22.58 |
| AY 2016-17 | 2559 | 9588 | 26.69 |
| AY 2017-18 | 2308 | 10127 | 22.29 |
| AY 2018-19 | 2486 | 10057 | 24.72 |
| AY 2019-20 | 2562 | 10116 | 25.3 |
| AY 2020-21 | 2420 | 9303 | 26.0 |
| AY 2021-22 | 2157 | 8875 | 24.3 |
| AY 2022-23 | 2012 | 8950 | 22.5 |
| AY 2023-24 | 2074 | 8826 | 23.5 |
| AY 2024-25 | 2091 | 9101 | 23.0 |
| Goal AY 2025-26 | - | - | 24.0 |
Data Source: Fresh Degrees Conferred by Term(s) file and Frozen Enrollment Summaries. *Goals are set at one degree higher than the three-year average for degrees conferred per 100 FTE students. Academic year is considered to be Fall, Spring, Summer.
| Academic Year | Degrees Conferred | FTE Degree Seeking Students | Ratio of Degrees Conferred to 100 FTE |
|---|---|---|---|
| AY 2015-16 | 278 | 659 | 42.19 |
| AY 2016-17 | 313 | 675 | 46.37 |
| AY 2017-18 | 323 | 661 | 48.87 |
| AY 2018-19 | 338 | 653 | 51.76 |
| AY 2019-20 | 366 | 655 | 55.80 |
| AY 2020-21 | 400 | 712 | 56.18 |
| AY 2021-22 | 347 | 643 | 53.97 |
| AY 2022-23 | 274 | 618 | 44.34 |
| AY 2023-24 | 298 | 722 | 41.27 |
| AY 2024-25 | 350 | 741 | 47.23 |
| Goal AY 2025-26 | - | - | 45.30 |
Data Source: Fresh Degrees Conferred by Term(s) file and Frozen Enrollment Summaries. *Goals are set at one degree higher than the three-year average for degrees conferred per 100 FTE students. Academic year is considered to be Fall, Spring, Summer.
Transfer
Tracking Academic Year Unduplicated Enrollment
| AY 2022-2023 | AY 2023-2024 | |
|---|---|---|
| Unduplicated Academic Year Enrollment | 18,314 | 18,429 |
| Graduated by the End of the Academic Year | 13.4% | 14.8% |
| Not Graduated, Retained One Academic Year Later | 50.5% | 50.0% |
| Not Graduated, Transferred One Academic Year Later | 14.0% | 13.4% |
| Not Graduated, Not Transferred One Academic Year Later | 22.1% | 21.9% |
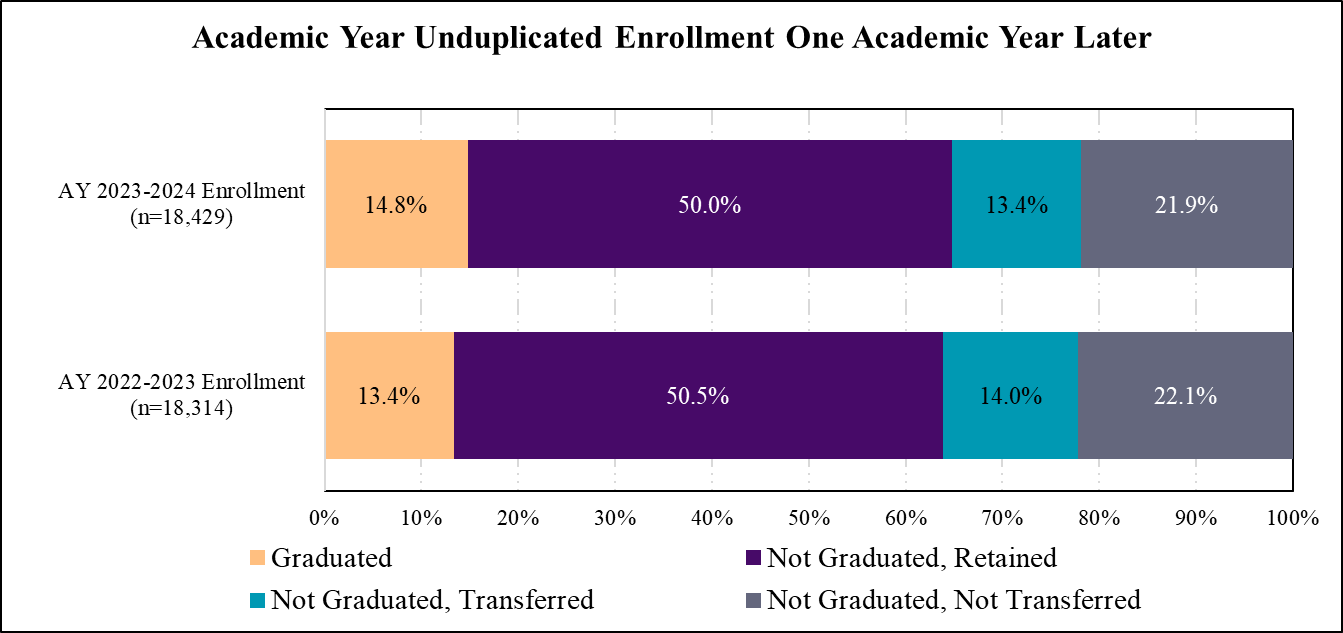
Data Sources: Frozen Enrollment Summaries, fresh Degrees Conferred, and supplemental data from National Student Clearinghouse. Academic Year (AY) is consisted to be Fall, Spring, Summer. Please note that the retained percentage above is different than the retention numbers found on the Retention webpage. True retention tracks a First Time in College (FTIC) cohort while the above number considers all unduplicated students enrolled, regardless of whether they are FTIC students. Because the starting cohorts are different, the two retention numbers should not be used interchangeably. Please refer to the Retention webpage for up-to-date retention numbers.
Not Graduated, Transferred Students One Academic Year Later
| AY 2022-2023 | AY 2023-2024 | |
|---|---|---|
| Not Graduated, Transferred Students | 2,567 | 2,461 |
| Transferred to Florida Gulf Coast University | 30.9% | 34.3% |
| Transferred to a Florida 2-Year Public Institution, Excluding FSW | 12.3% | 9.6% |
| Transferred to a Florida 4-Year Public Institution, Excluding FGCU | 27.3% | 28.6% |
| Transferred to a Florida Private Institution | 9.5% | 8.0% |
| Transferred to a Non-Florida Institution | 19.9% | 19.5% |
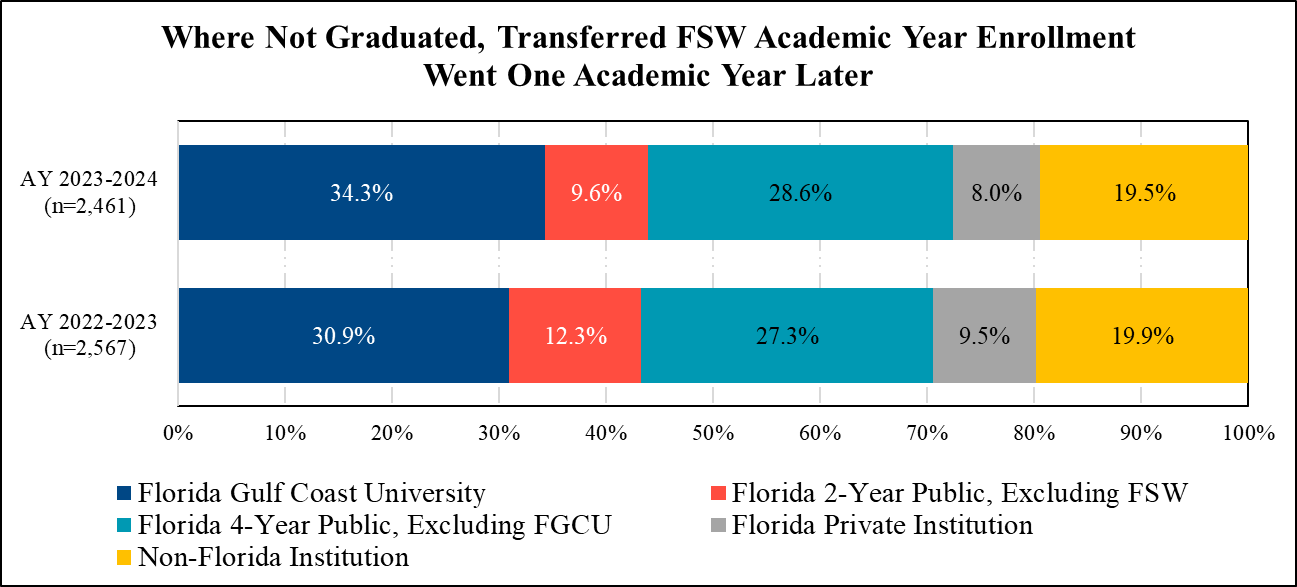
Data Sources: Frozen Enrollment Summaries, fresh Degrees Conferred, and supplemental data from National Student Clearinghouse. Academic Year (AY) is consisted to be Fall, Spring, Summer.
Continuing Education
Tracking Academic Year Unduplicated Graduates
| AY 2022–2023 Graduates | AY 2023–2024 Graduates | |
|---|---|---|
| Unduplicated Academic Year Graduates | 2,503 | 3,002 |
| Continued at FSW One Academic Year Later | 23.9% | 28.8% |
| Continued at Florida Gulf Coast University One Academic Year Later | 16.0% | 10.2% |
| Continued at a Florida 2-Year Public Institution (excluding FSW) One Academic Year Later | 1.3% | 0.8% |
| Continued at a Florida 4-Year Public Institution (excluding FGCU) One Academic Year Later | 12.6% | 7.6% |
| Continued at a Florida Private Institution One Academic Year Later | 1.5% | 0.8% |
| Continued at a Non-Florida Institution One Academic Year Later | 5.7% | 4.2% |
| Unknown One Academic Year Later | 39.2% | 47.7% |
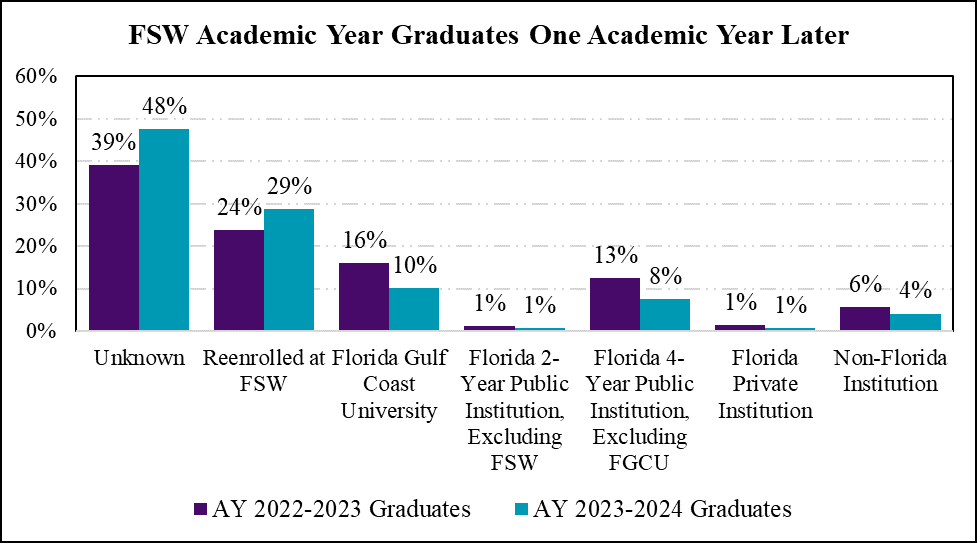
Data Sources: Frozen Enrollment Summaries, fresh Degrees Conferred, and supplemental data from National Student Clearinghouse. Academic year is considered at be Fall, Spring, Summer.
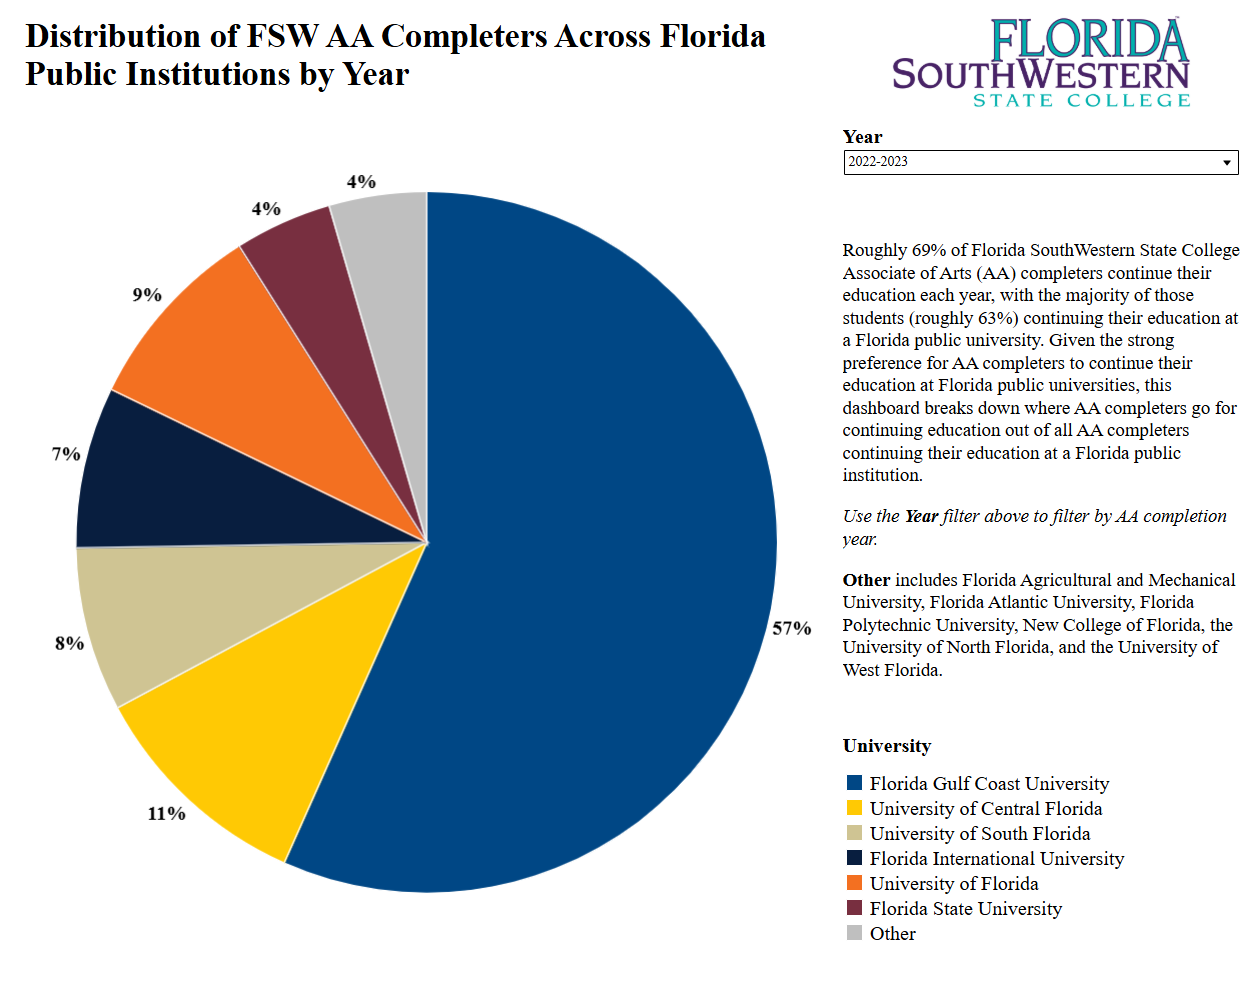
Click the image above to explore FSW AA Completers Continuing Education at SUS Institutions. Please note that the dashboard is hosted on an external webpage, and clicking the image will redirect you there. Data source: Florida Education & Training Placement Information Program (FETPIP).